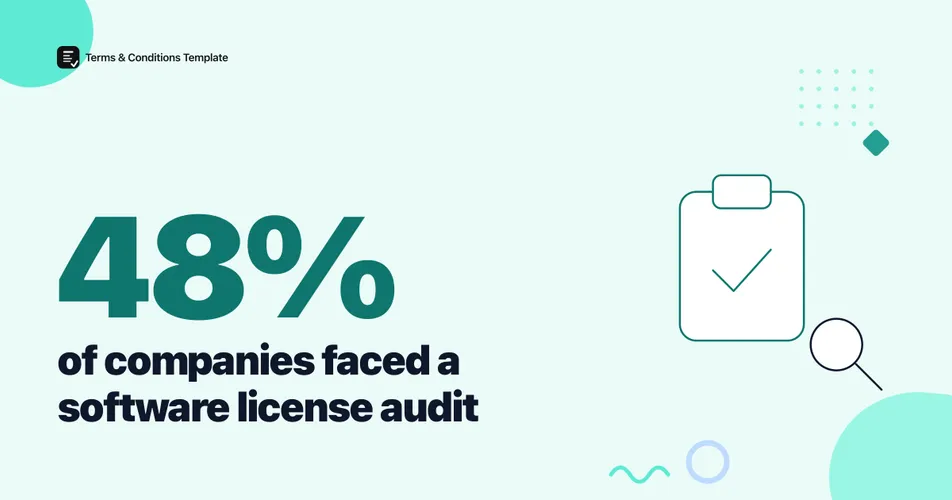
Software license audits hit a new high in 2026. 48% of organizations were audited for license compliance in the past year, per Flexera’s 2026 State of ITAM Report, a survey of more than 500 IT asset management professionals fielded in early 2026, and 44% of them spent over $1 million on audits in the past three years. That figure sits alongside a licensing landscape that is also getting harder to manage on the technical side, from record open source license conflicts to a software market still growing faster than the rest of IT.
Below is what the audit data, the market-size forecasts, and the open source compliance research actually say, with the primary source named for every number.
How many companies get audited for software license compliance?
Software audits are no longer a rare event. 48% of organizations said they had been audited for license compliance in the past year, according to Flexera’s 2026 State of ITAM Report. Among those audited, 44% reported spending more than $1 million on audit-related costs over the past three years, with the largest single spending band, 21% of respondents, landing between $1 million and $2 million.
That is not a niche compliance concern reserved for enterprise IT departments. Nearly half of the surveyed organizations, spanning a range of company sizes, went through the process, and the cost band above $1 million was common enough to be the single largest reported bracket.
Figure 1: Share of organizations audited for software license compliance in the past year. Source: Flexera 2026 State of ITAM Report, 500+ ITAM professionals surveyed.
A EULA generator will not stop an audit from happening, but a current, accurate license agreement is exactly the document an auditor asks for first, and it is the fastest way to close out a compliance review without a dispute over what was actually agreed to.
Which software vendors run the most license audits?
Microsoft is the name behind most of the audit activity organizations reported. 64% of audited organizations in Flexera’s 2026 survey named Microsoft as one of the vendors that had audited them, well ahead of any other publisher in the report. Flexera has separately flagged that Microsoft licensing terms and price changes have been accelerating, which tracks with the volume of audit activity organizations are reporting around that vendor specifically.
| Metric | Figure | Source |
|---|---|---|
| Organizations audited in the past year | 48% | Flexera 2026 State of ITAM Report |
| Audited orgs reporting a Microsoft audit | 64% | Flexera 2026 State of ITAM Report |
| Spent over $1M on audits, past 3 years | 44% | Flexera 2026 State of ITAM Report |
| Largest single audit-cost bracket ($1M-$2M) | 21% | Flexera 2026 State of ITAM Report |
A vendor auditing more than half of the customers who get audited at all is not a random sample of enforcement activity, it is a concentrated pattern that IT asset management teams plan around every renewal cycle.
How big is the worldwide software licensing market in 2026?
Software is the fastest-growing category in worldwide IT spending. Gartner’s October 2025 forecast, presented at the Gartner IT Symposium/Xpo by analyst John-David Lovelock, put worldwide software spending at $1.43 trillion in 2026, up 15.2% from 2025, outpacing every other segment Gartner tracks including data center systems, devices, IT services, and communications services.
Figure 2: 2026 worldwide IT spending forecast by segment. Source: Gartner, worldwide IT spending forecast, October 2025.
We could not locate a primary, sample-sized breakdown of what share of that $1.43 trillion is subscription/SaaS licensing versus perpetual, on-premises licensing. Several secondary aggregator sites publish a specific split, but none of the ones we checked traced back to a named Gartner or IDC line item we could verify directly, so we are not repeating that number here. What is verifiable is the audit pattern above: subscription renewals and perpetual license true-ups are both counted inside that $1.43 trillion, and both are subject to the audit activity Flexera measured.
How common are open source license conflicts in commercial software?
Open source license risk climbed sharply in the most recent measurement. Black Duck’s 2026 Open Source Security and Risk Analysis (OSSRA) report found that 68% of the 947 commercial codebases it scanned across 17 industries contained at least one open source license conflict, up from 56% in the prior year’s report, the largest year-over-year increase the report has recorded since it began. Separately, 98% of those same codebases contained open source code of some kind, confirming that almost no commercial codebase is free of third-party licensing terms to track.
Figure 3: Timeline of the major software licensing compliance data points cited in this article. Sources: BSA 2018, Black Duck OSSRA 2025 and 2026 reports.
Black Duck’s report also flags a new contributor to the jump: AI-generated code snippets that reproduce copyleft-licensed source without preserving the original license notice, a pattern the report calls license laundering. Only 54% of organizations say they currently evaluate AI-generated code for intellectual property and licensing risk before it ships, leaving the other 46% with a growing blind spot at exactly the moment license conflicts are rising fastest.
Figure 4: The compliance test behind rising open source license conflicts. Source: synthesized from Black Duck 2026 OSSRA findings above.
The direction of travel matters more than any single year’s number. Open source usage is now close to universal, license conflict rates are climbing at their fastest pace on record, and AI-generated code is adding a new source of risk that fewer than half of organizations are currently checking for.
Where does licensing risk concentrate across different license models?
Not every licensing model carries the same kind of exposure. Perpetual, on-premises software like the Microsoft products behind most reported audits carries concentrated vendor-audit risk tied to renewal and true-up cycles. Open source components carry technical compliance risk that scales with codebase size and now with AI-assisted code generation. Subscription and SaaS licensing shifts much of the audit burden onto usage and seat-count reconciliation rather than installed-copy counting, though we could not verify a sample-sized figure for how audit rates differ by model specifically.
Figure 5: Editorial positioning of license model risk, synthesized from the audit and OSSRA data discussed above, not an independent measurement. Source: this article’s analysis of Flexera 2026 and Black Duck 2026 OSSRA findings.
Businesses evaluating end user license agreements for a broader open source usage and licensing model comparison should note that a companion piece on open source adoption statistics for this cluster has not been published yet; we are not linking to a placeholder for it. What is already documented is how little of a license agreement gets read once it is in front of a user: 91% of consumers skip EULAs entirely before agreeing, which is exactly why a compliance-defensible document matters more than a user-facing one.
The Bottom Line
Software licensing got measurably harder to stay ahead of in 2026. Nearly half of organizations were audited in the past year, Microsoft accounts for most of that audit activity, and the software market those licenses sit inside is now worth $1.43 trillion and growing faster than any other IT category. Underneath the market numbers, the technical compliance picture worsened just as fast: open source license conflicts hit a record 68% of codebases scanned, and AI-generated code is adding risk that fewer than half of organizations currently check for. None of this is going to slow down on its own. A software business that keeps its own end user license agreement current, and that can show exactly what it licenses, from whom, and under what terms, is in a materially stronger position the next time an auditor calls.
Frequently Asked Questions
What percentage of companies get audited for software license compliance? 48% of organizations were audited for software license compliance in the past year, and 44% spent more than $1 million on audits over the past three years, according to Flexera’s 2026 State of ITAM Report, a survey of more than 500 IT asset management professionals fielded in early 2026.
Which software vendor runs the most license audits? Microsoft, by a wide margin. 64% of audited organizations in Flexera’s 2026 State of ITAM Report named Microsoft as an auditor, more than any other vendor in the survey.
How big is the worldwide software market in 2026? Gartner forecasts worldwide software spending will reach $1.43 trillion in 2026, up 15.2% from 2025, the fastest growth of any IT segment Gartner tracks, according to its October 2025 IT spending forecast.
How common are open source license conflicts in commercial software? 68% of commercial codebases scanned in Black Duck’s 2026 OSSRA report contained at least one open source license conflict, up from 56% the year before, the largest year-over-year jump in the report’s history. The analysis covered 947 codebases across 17 industries.
Sources and References
- Flexera. (2026). “State of ITAM Report: How Governance Gaps Are Driving Costly Software Audits.” Survey of 500+ IT asset management professionals, fielded early 2026.
- Gartner, Inc.. (2025). Worldwide IT Spending Forecast, presented at Gartner IT Symposium/Xpo, October 2025, analyst John-David Lovelock. Software segment: $1.43 trillion in 2026, up 15.2%.
- Black Duck (formerly Synopsys). (2026). “Open Source Security and Risk Analysis (OSSRA) Report.” 947 commercial codebases scanned across 17 industries, November 2024 to October 2025.
- Business Insider, reporting BSA. (2018). “37% of Software Installed on PCs Worldwide Is Unlicensed, Worth $46.3 Billion.” BSA Global Software Survey, most recently published edition.
Note: All figures verified as of September 2026. The Gartner and Flexera figures are current-year forecasts and survey results subject to quarterly revision; the BSA figure is the last published edition of that survey, with no newer edition identified as of this writing. Figures are re-checked at least twice a year for fresher primary sources.