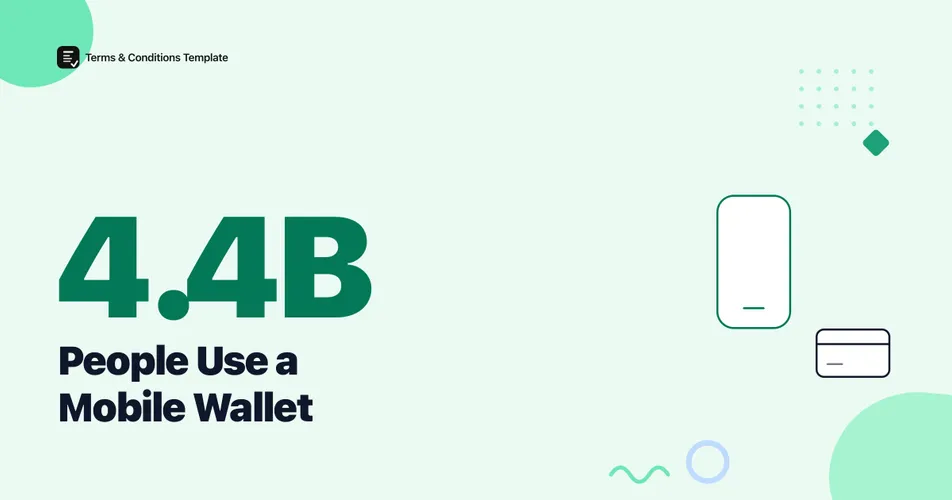
4.4 billion people worldwide used a digital wallet in 2025, according to a November 2025 forecast from Juniper Research, and that number is growing fast enough to reshape how a store gets paid and how it processes a refund. In the United States specifically, in-store mobile wallet use more than doubled in a single year, from roughly 14% of shoppers to 31%, per PYMNTS Intelligence. This is what the adoption curve actually looks like heading into 2026, and what it means for a merchant’s payment and refund terms.
How many people worldwide use a mobile wallet?
4.4 billion people globally used a digital wallet of some kind in 2025, according to Juniper Research, a market analyst firm that tracks the digital payments industry. Juniper projects that figure will grow 35% over the next five years, putting wallet users past 6 billion, more than three-quarters of the world’s projected population, by 2030.
Juniper Research sells market forecasts and benchmarking reports to the payments industry, so it has a commercial interest in digital wallets looking like a growth story. The 4.4 billion figure comes from the firm’s own modeling across more than 60 countries and 85,000-plus data points rather than a disclosed public opinion survey, so it should be read as an informed market estimate, not an audited headcount. What corroborates the direction, if not the exact figure, is independent, government-collected US data further down this page showing the same fast climb.
A wallet user is not automatically a frequent wallet user, and the gap between having a wallet installed and actually reaching for it at checkout is where most of the real story sits.
Is mobile wallet growth mostly happening online, or at the checkout counter?
Both, and the in-person side is catching up fast. Payment apps are on track to power 46% of global point-of-sale (in-person) transaction value by 2030, up from 33% in 2025, according to Worldpay’s Global Payments Report 2026, an annual study from the payment processor now operating as Global Payments. In Hong Kong specifically, digital wallet spending surpassed card spending for the first time in 2025, per the same report.
Figure 1: Payment apps’ growing share of in-person, point-of-sale spending worldwide. Source: Worldpay, Global Payments Report 2026.
Worldpay is a payment processor with a direct commercial stake in wallet volume growing, so treat its market-share figures as directional industry data rather than an independent audit; the underlying report draws on a stated survey of 63,000-plus consumers across 42 markets. Online spending tells a similar story: Worldpay puts digital wallets at 56% of global e-commerce transaction value in 2025, already ahead of cards and every other single payment method combined.
Point-of-sale wallet use is catching up to online wallet use, not staying behind it, which matters for any store that still treats “wallet payments” as a checkout-page-only problem.
How fast is mobile wallet use growing in US stores?
31% of US consumers used a mobile wallet in-store during the week PYMNTS Intelligence fielded its “Apple Pay @11” survey in September 2025, more than double the roughly 14% rate measured a year earlier. PYMNTS surveyed 3,339 US consumers between mid-August and late September 2025, and published the findings on November 26, 2025.
Figure 2: Share of US consumers who used a mobile wallet in a physical store in the week surveyed. Source: PYMNTS Intelligence, “Apple Pay @11,” September 2025 fielding, n=3,339.
| Metric | Figure | Year | Source |
|---|---|---|---|
| Global digital wallet users | 4.4 billion | 2025 | Juniper Research |
| Global e-commerce spend via wallets | 56% | 2025 | Worldpay GPR 2026 |
| US in-store mobile wallet use | 31% | Sept. 2025 | PYMNTS Intelligence |
| US mobile-phone share of all payments | ~23% | 2024 | Federal Reserve (calculated) |
A store that still treats mobile wallet acceptance as optional is opting out of the payment method roughly a third of its in-person US customers already reached for last September.
Which wallet brand is winning new US users?
Apple Pay held roughly steady at about 10% of eligible in-store transactions in 2025, according to PYMNTS Intelligence, even as its competitors grew much faster off smaller bases. Google Pay’s weekly in-store usage more than doubled year over year, while PayPal and Cash App usage each nearly doubled over the same period.
| Wallet | US in-store metric (2025) | Approx. YoY change | Source |
|---|---|---|---|
| Apple Pay | ~10% of eligible transactions | Roughly steady | PYMNTS Intelligence |
| Google Pay | Weekly usage | More than doubled | PYMNTS Intelligence |
| PayPal | Weekly usage | Nearly doubled | PYMNTS Intelligence |
| Cash App | Weekly usage | Nearly doubled | PYMNTS Intelligence |
Apple Pay also processed roughly $450 billion in US sales volume over the trailing year, about 6% of total in-store purchase value, per PYMNTS Intelligence’s estimate. A store accepting a wider mix of wallets, not just the one with the biggest single share, is accepting the payment methods its actual customer base is switching to fastest. A refund policy that only describes “refunds to your original card” leaves out a meaningful and fast-growing share of shoppers who never entered a card number at all; a Refund Policy Generator that explicitly covers wallet-routed refunds closes that gap.
No single wallet is winning outright. What is happening is broader: more of the market is choosing some wallet over a swiped or tapped physical card.
How often do Americans actually pay with a phone instead of a card?
US consumers made an average of 11 payments per month with a mobile phone in 2024, up from just 4 payments per month in 2018, according to the Federal Reserve’s Diary of Consumer Payment Choice, a nationally representative survey fielded every October since 2016. That is nearly a threefold increase in six years, and it came alongside a rise in remote payments broadly: 23% of consumer purchases and peer-to-peer payments were made remotely in 2024, a share that has grown every year since 2021.
Figure 3: Average monthly payments US consumers made using a mobile phone. Source: Federal Reserve, 2025 Diary of Consumer Payment Choice (fielded October 2024).
With US consumers making 48 total payments per month on average in 2024 per the same Federal Reserve report, those 11 mobile-phone payments work out to roughly 23% of every payment Americans made that year, a share calculated directly from the Fed’s own published figures. That is a government-collected, independent number, not a vendor forecast, and it points the same direction as the PYMNTS and Worldpay data above: more of every kind of payment is shifting onto a phone.
The Federal Reserve’s data does not use the word “wallet” specifically; it counts any payment made with a mobile phone as the instrument, which includes wallet taps but is not perfectly identical to wallet ownership. Even with that caveat, the growth trend across four independent sources, one analyst firm, one payment processor, one industry researcher, and the Federal Reserve, agrees on direction and rough magnitude.
Do younger adults use mobile wallets differently than everyone else?
Yes, and by a wide margin. Adults aged 18 to 24 made 45% of all their payments with a mobile phone in 2024, compared with roughly 23% across all US consumers that same year, according to the Federal Reserve’s Diary of Consumer Payment Choice.
That generational gap is the clearest signal of where the national average is headed next. Households earning under $25,000 a year and adults 55 and older still lean more heavily on cash, per the same Fed report, while the youngest adult cohort has already made mobile the plurality of how it pays. A store’s customer base skews toward whichever end of that gap its typical buyer sits on, and a checkout or refund flow built only around cards is a worse fit for the younger half of that split.
Generational gaps in payment behavior tend to compress over time as the younger cohort ages, not reverse, which is one more reason mobile wallet acceptance looks less like a trend and more like a baseline expectation forming now.
Where is mobile wallet adoption headed next?
Figure 4: Key mobile wallet adoption data points from 2018 through the 2030 projection. Sources: Federal Reserve, Juniper Research, PYMNTS Intelligence, Worldpay Global Payments Report 2026.
This growth sits inside a broader shift toward mobile as the default commerce channel generally, not just for wallets; see our mobile commerce statistics for 2026 for how that plays out in cart abandonment and traffic share, and our in-app purchase statistics for 2026 for how a related but distinct category of mobile spending is trending. How much of wallet-driven spending specifically flows through social commerce checkouts, as opposed to traditional online and in-store checkouts, is a related question we do not yet have dedicated figures on.
Every independent data source points the same direction and none point down, which is unusual for a payments trend and worth taking at face value.
The Bottom Line
Mobile wallet use crossed a real threshold in 2025: 4.4 billion people worldwide have one, US in-store use more than doubled in a single year, and US consumers now make nearly a quarter of all their payments with a phone rather than a card or cash. None of the four sources behind these numbers, an analyst firm, a payment processor, an industry researcher, and the Federal Reserve, agree on the exact size of the shift, but all four agree on its direction and speed. For a store owner, the practical question is no longer whether to accept mobile wallets; PYMNTS’ 31% in-store figure already answers that. The remaining question is whether a refund and payment policy written for card numbers still makes sense when a third of in-person shoppers, and closer to half of the youngest ones, are paying a different way.
Frequently Asked Questions
How many people worldwide use a mobile wallet? 4.4 billion people worldwide used a digital wallet in 2025, and that number is on track to exceed 6 billion, more than three-quarters of the projected global population, by 2030, according to Juniper Research’s November 2025 forecast.
How fast is mobile wallet use growing in US stores? 31% of US consumers used a mobile wallet in-store during the week PYMNTS Intelligence fielded its September 2025 survey of 3,339 US consumers, more than double the roughly 14% rate measured a year earlier.
How often do Americans pay with a mobile phone instead of a card or cash? US consumers made an average of 11 payments per month with a mobile phone in 2024, up from just 4 payments per month in 2018, according to the Federal Reserve’s Diary of Consumer Payment Choice.
Do younger adults use mobile wallets more than older adults? Yes. Adults aged 18 to 24 made 45% of all their payments with a mobile phone in 2024, roughly double the approximately 23% share among US consumers overall that same year, per Federal Reserve data.
Sources and References
- Juniper Research. (2025). “Digital Wallet Users to Surpass Three Quarters of Global Population by 2030.” Global wallet user forecast, 60+ countries, published November 10, 2025.
- PYMNTS Intelligence. (2025). “Apple Pay @11: Usage Is Up, but Competitors Are Gaining Ground.” Survey of 3,339 US consumers, fielded mid-August to late September 2025, published November 26, 2025.
- Federal Reserve Financial Services / FedCash Services. (2025). “2025 Diary of Consumer Payment Choice.” Nationally representative survey fielded October 2024.
- Worldpay (Global Payments). (2026). “Global Payments Report 2026.” Survey of 63,000+ consumers across 42 markets, 11th annual edition.
Note: All figures verified as of September 2026. Global wallet-user and point-of-sale share figures come from analyst and payment-industry sources without a fully disclosed consumer sample and should be read as directional; the Federal Reserve figures carry disclosed government survey methodology and are the most independently verifiable numbers in this article. Headline figures are refreshed at least twice a year.